
That little "AQI" number sits right there on your weather app, next to the temperature. Most of us glance past it. Maybe we notice it's there, but what does 156 actually mean? Is that bad? Should you cancel your evening walk?
Here's the thing – reading air quality numbers isn't rocket science. You just need someone to explain it plainly.
What Is the Air Quality Index?
Think of AQI as a translator. Scientists measure stuff floating in the air – tiny particles, gases, chemicals. Then they convert all that complicated data into one number. Simple.
The numbers? They go from 0 to 500. Low numbers mean cleaner air. High ones mean... well, maybe don't go outside.
It's designed so anyone can look at a number and immediately know if the air's safe or if they need to take precautions. No science degree required.
Understanding the AQI Scale

0-50: Good (Green)
Air's clean. Go outside, exercise, do whatever. No worries.
51-100: Moderate (Yellow)
Decent for most people. But if you've got asthma or breathing issues, maybe don't go too hard on outdoor cardio.
101-150: Unhealthy for Sensitive Groups (Orange)
Kids, elderly folks, anyone with respiratory problems – this is your heads-up. Everyone else can usually manage fine.
151-200: Unhealthy (Red)
Now everybody starts feeling it. Chest tightness, random coughing. The air's genuinely not great.
201-300: Very Unhealthy (Purple)
Bad for everyone, not just sensitive groups. Serious health effects become likely.
301-500: Hazardous (Maroon)
Emergency level. Delhi hits this sometimes during winter. Schools close, events get cancelled. Stay indoors if possible.
What Do the AQI Colors Mean?
Colors make this even easier. You don't need to memorize exact numbers. Just remember the colors:
Green = you're good to go
Yellow = mostly fine, no worries
Orange = if you're sensitive, be careful
Red = everyone should limit outdoor time
Purple = really not good
Maroon = hazardous, stay inside
Glance at the color, make your decision. That's it.
What Is PM 2.5 and Why Does It Matter?
Air quality reports always call out PM 2.5 separately. Not just an extra detail – it's actually the main problem in most Indian cities.

PM stands for Particulate Matter. The 2.5? That's the size – 2.5 micrometers or less. Want some perspective? A single human hair measures about 70 micrometers across. We're talking particles about 30 times smaller than that. Crazy small.
Where do they come from?
Cars, trucks, construction activity. Factories releasing emissions. Crop fires during harvest season. Basically any combustion happening in and around cities produces them.
The size is what makes them dangerous. Bigger dust particles? Your nose and throat catch those. But PM 2.5 slips past all that. Goes straight into the deepest parts of your lungs. Sometimes crosses into your bloodstream.
Delhi's winter AQI hits 250 or higher mostly because of PM 2.5. Same story in Mumbai, Kolkata, Bangalore – wherever you see bad air quality in Indian cities, PM 2.5 is usually driving those numbers up.
Which Pollutants Are Measured?
AQI tracks six different pollutants. Your final number reflects whichever one's worst at that moment:

PM 2.5 – the tiny particles (India's biggest problem)
PM10 – bigger stuff, dust, pollen
Ozone – shows up on those really hot, sunny days
Nitrogen dioxide – mostly from traffic
Sulfur dioxide – industrial emissions
Carbon monoxide – comes from vehicle exhaust
Your app usually tells you which one's dominant. Winter in Delhi = PM 2.5. Summer in coastal cities = could be ozone.
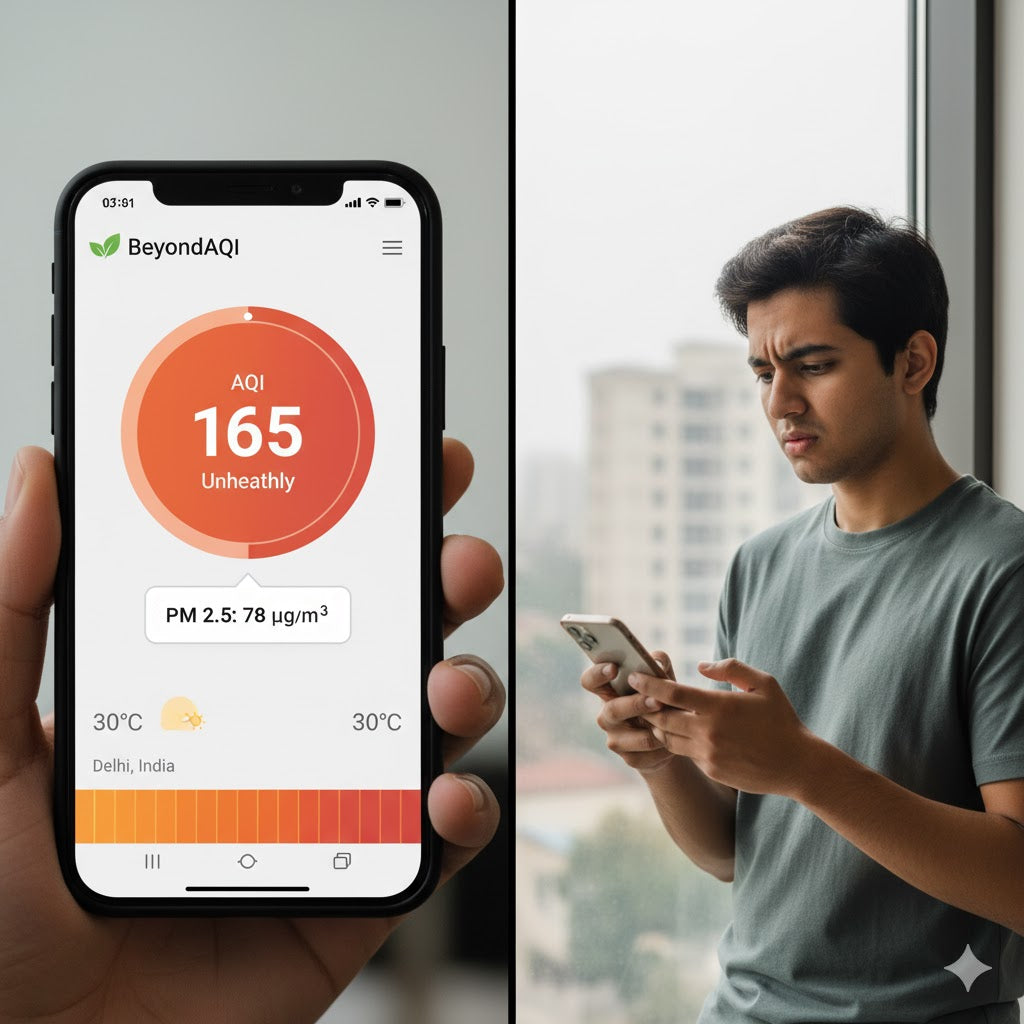
How Do I Read My Local AQI?
Let's use a real example. You check BeyondAQI and see 165 in orange-red. Primary pollutant: PM 2.5 at 78 µg/m³.
 What that means:
165 = "Unhealthy" range
Orange-red = elevated pollution confirmed
PM 2.5 = fine particles are the problem
What to do = skip outdoor exercise or at least don't push yourself
Number, color, pollutant, action. Takes ten seconds once you know what you're looking at.
Does AQI Change Throughout the Day?

Absolutely. And this trips people up all the time.
Morning shows 75. Looks good. But by evening rush hour? Could be 160. Traffic, weather patterns, temperature changes – they all affect pollution levels hour by hour.
Key factors:
Rush hour traffic spikes the numbers
Wind either clears pollution or traps it
Temperature inversions trap everything near ground level
Time of day affects which pollutants dominate
Planning outdoor activities? Check multiple times, not just once in the morning.
Where Can I Find Reliable AQI Data?
Not all air quality sources are equal. Look for:
Real-time updates (yesterday's data helps nobody)
Neighborhood-level readings (city averages hide too much)
Which pollutant is causing the problem
Historical patterns
BeyondAQI gives localized, real-time data across Indian cities. That matters. Because here's the thing – Dwarka's air can be completely different from Noida's air. Even though they're both technically "Delhi NCR." City-wide averages? Not much help when you're literally standing at your door trying to decide if it's safe to step outside right now.
Quick Reference
Worth saving this:
0-50 → safe for everything
51-100 → generally okay, sensitive people stay aware
101-150 → limit heavy outdoor exercise
151-200 → everyone cut back outdoor time
200+ → stay inside when possible
Why This Matters
Air pollution affects your lungs, your heart, your overall health. The research on this is pretty clear.
But knowing how to read these numbers gives you power. You can check before going out. You can plan activities when air's cleaner. You can make actual informed decisions instead of just hoping for the best.
Most weather apps already show AQI. You just needed to understand what the numbers meant.
So tomorrow, before heading out – check that number. Look at the color. Then decide what makes sense. Adjust your plans if you need to. Or at least know what you're breathing.
Small habit. Big difference over time.


Share:
Why Does AQI Increase in Winter? The Science of Cold-Weather Pollution
What is a Good AQI? Safe and Healthy Air Quality Index Levels Explained
1 comment
92nri1